Rapid Candidate Biomarker Discovery With PanHunter
According to the WHO Global Health estimates, colon and rectum cancers are among the top 10 causes of death in western countries, amounting to over 900,000 deaths every year, globally. As with many forms of cancer, early detection and clear diagnosis are key to apply the right therapy to achieving full recovery and the best possible life expectancy. Hence, identifying and linking molecular markers unambiguously to a specific type of cancer is a crucial achievement towards better and affordable point of- care diagnostics in preventive medicine, as molecular markers can detect diseases long before the appearance of macroscopic symptoms and often also allow for a more targeted diagnosis. “The Cancer Genome Atlas” (TCGA) collected molecular omics data from cancer patients in combination with clinical information to facilitate general cancer research including, e.g., candidate biomarker discovery. For this case study, the patient cohort for colon adenocarcinoma (‘TCGA_COAD’) will be used in PanHunterTM. After an initial look at clinical information (e.g., the distribution of samples in the cohort), the next step is the exploration of the molecular data. PanHunter’s New Comparisons app allows users to explore the omics data, in this case transcriptomes, in a very straightforward way: a very common and easily accessible visualization for this kind of exploration is a 2D plot of the dimensionality reduction (here, using the t-SNE algorithm) of the molecular expression data (Figure 7). In this plot, samples with similar gene activity are located close to each other, while those with larger differences are located further apart. As a result, a strong correlation of the tissue definition with the two major clusters was immediately visible, indicating a significant difference in gene activity between both tissue types. To focus on tumorous samples only, non-tumours samples can be deselected and/or the dataset reduced by free selection.
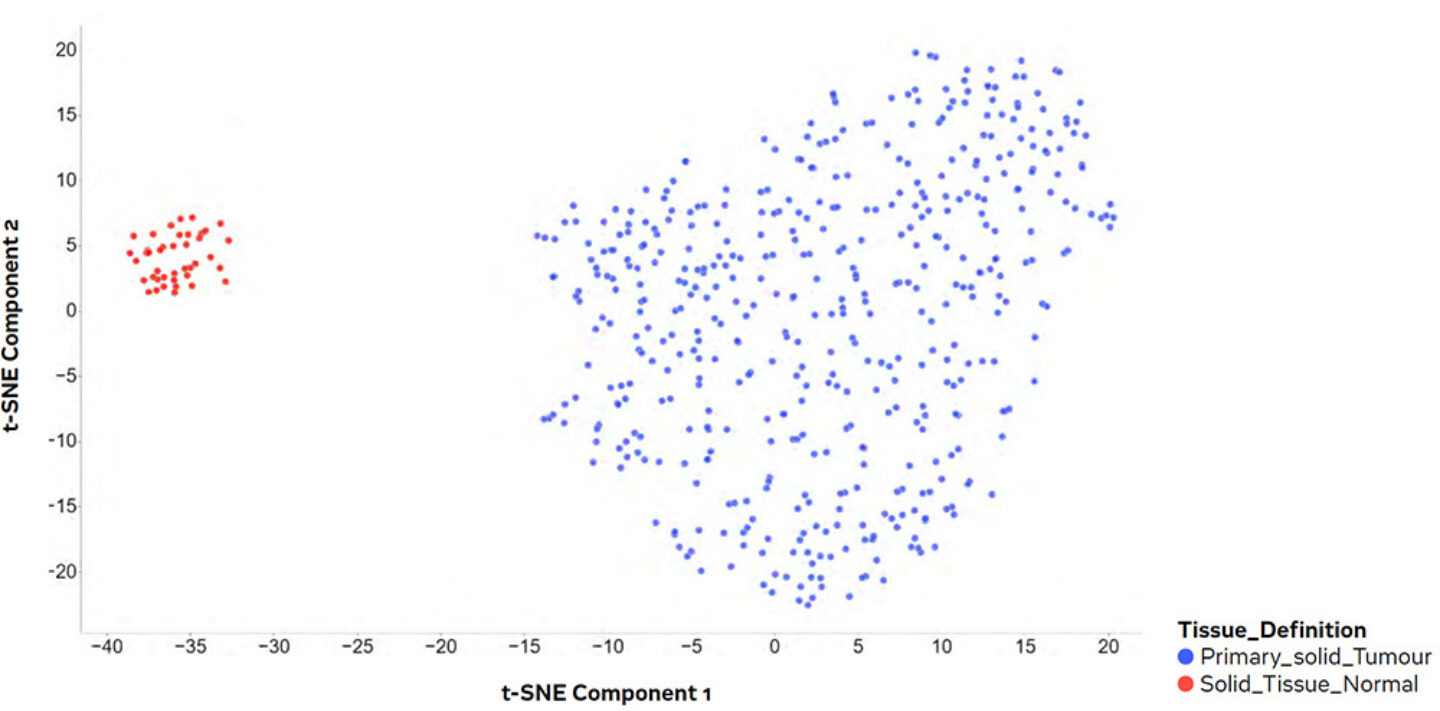
Figure 7: Dimensional reduction plot of the transcriptomics data, based on the expression data of the 500 most variant genes. Each dot is representing one sample/patient.
A new 2D plot, only using the new sample subset, was generated immediately, showing an evenly distributed cloud of samples without any obvious clusters (not shown). To assist research, PanHunter allows to search for driving factors of sample distribution: Exploratory Analysis. It can be used to search for parameters in the metadata of the samples, or even in the expression values of the genes themselves, that are responsible for the distribution of the samples across the 2D plot, using statistical methods. As a result, a list of possible genes was generated, showing REG4 on top (Figure 8).
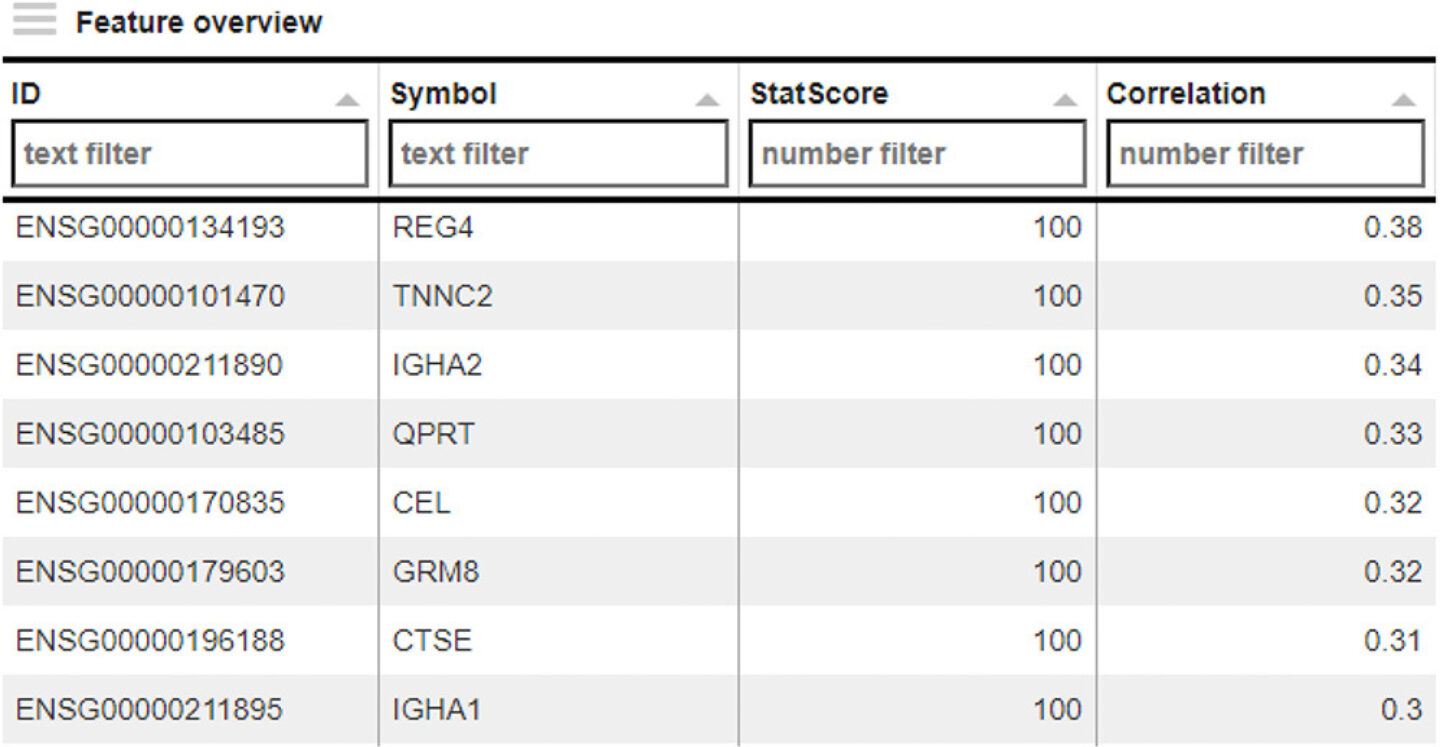
Figure 8: Result from exploratory analysis, listing several genes which might be driving the distribution of samples within the 2D plot of Figure 7.
To examine this result in a bit more detail, the coloration of the sample plot was changed to indicate the transcriptional intensity of that gene (Figure 9).
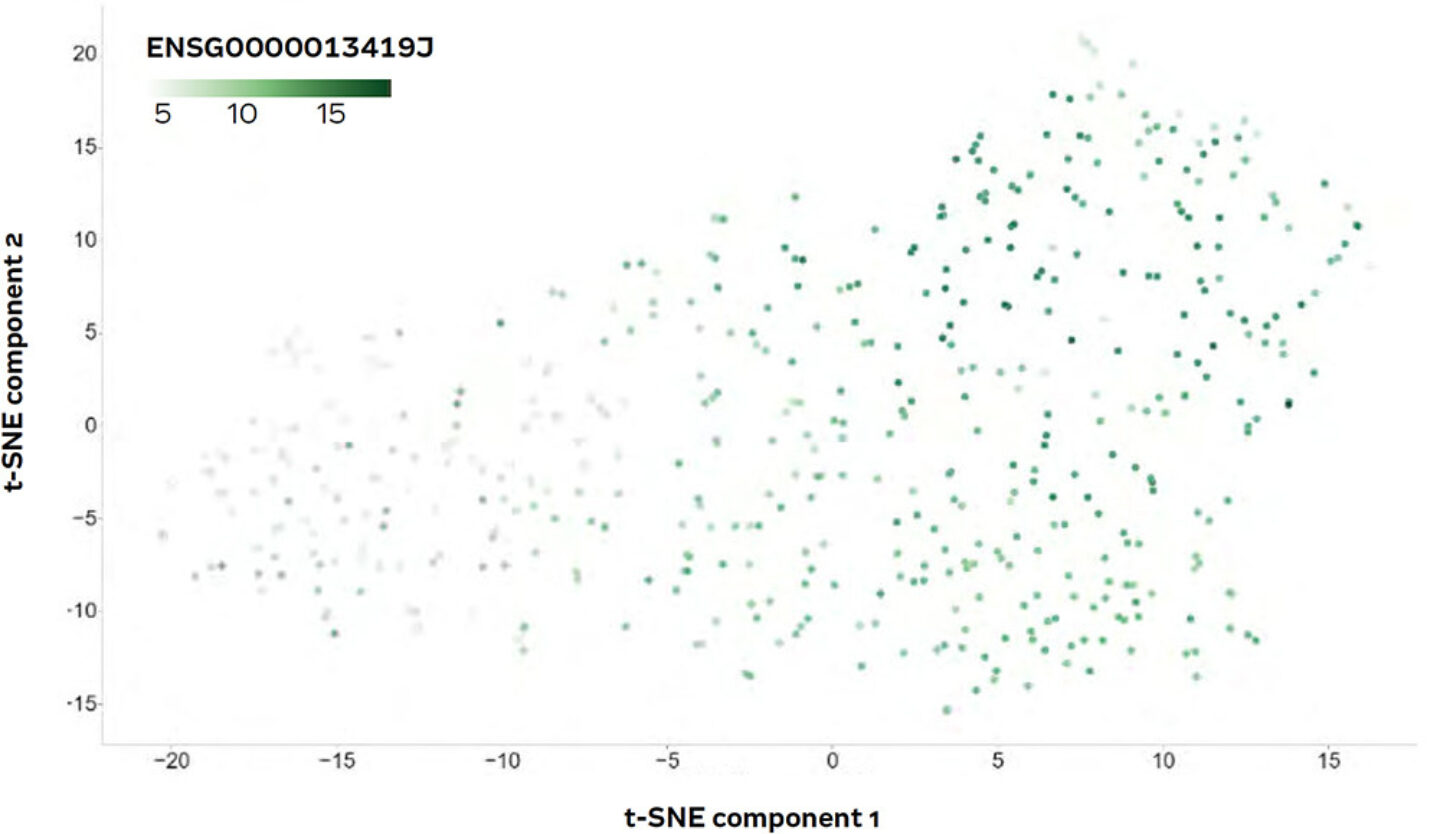
Figure 9: t-SNE plot coloured according to transcription intensity of the REG4 gene.
The resulting plot showed a clear gradient within the large cloud of samples, from low (light green) to high (dark green) transcriptional activity of REG4. The correlation of REG4 expression with the overall clustering of the patients was a first hint that the gene could be a potential marker gene.
A comparison between the activity of REG4 and survival of patients was performed in the Patient Data app. First, the patient cohort was divided into two sub-cohorts via a respective selection in the graphical user interface (GUI). Subsequently, one sub-cohort containing the lower 50% (red) and another one containing the upper 50% quantile (cyan) with respect to their REG4 expression were generated. As a result, a Kaplan-Meier plot was generated, indicating patient survival for both sub-cohorts. In the plot, a slight difference between the sub-cohorts was already visible: patients with high REG4 expression showed a slightly better survival rate. However, PanHunter pointed out that the correlation observed here was not significant p-value = 0.137.
As there are often gender specific differences in cancer, both sub-cohorts were filtered subsequently, again via a quick GUI setting to leave only male patients selected. As a result, the survival plot (Figure 10) was updated on-the fly and a much stronger difference for high vs. low REG4 expressing patients became visible, which was now also statistically significant (p-value = 0.0114). Hence, it was concluded that REG4 might indeed be a suitable biomarker to indicate the survival prognosis of colon adenocarcinoma patients and might help during diagnosis and assessing treatment responders and non-responder to drug treatment (which has also been reported in the literature). This case-study is one of several case studies that are also available as demo videos for PanHunter on YouTube.
The entire procedure from start to finish would take an average user with the necessary disease specific knowledge only a couple of hours when using PanHunter. All shown plots are taken directly from PanHunter, were generated on-the-fly, and no external/ additional tools were needed.
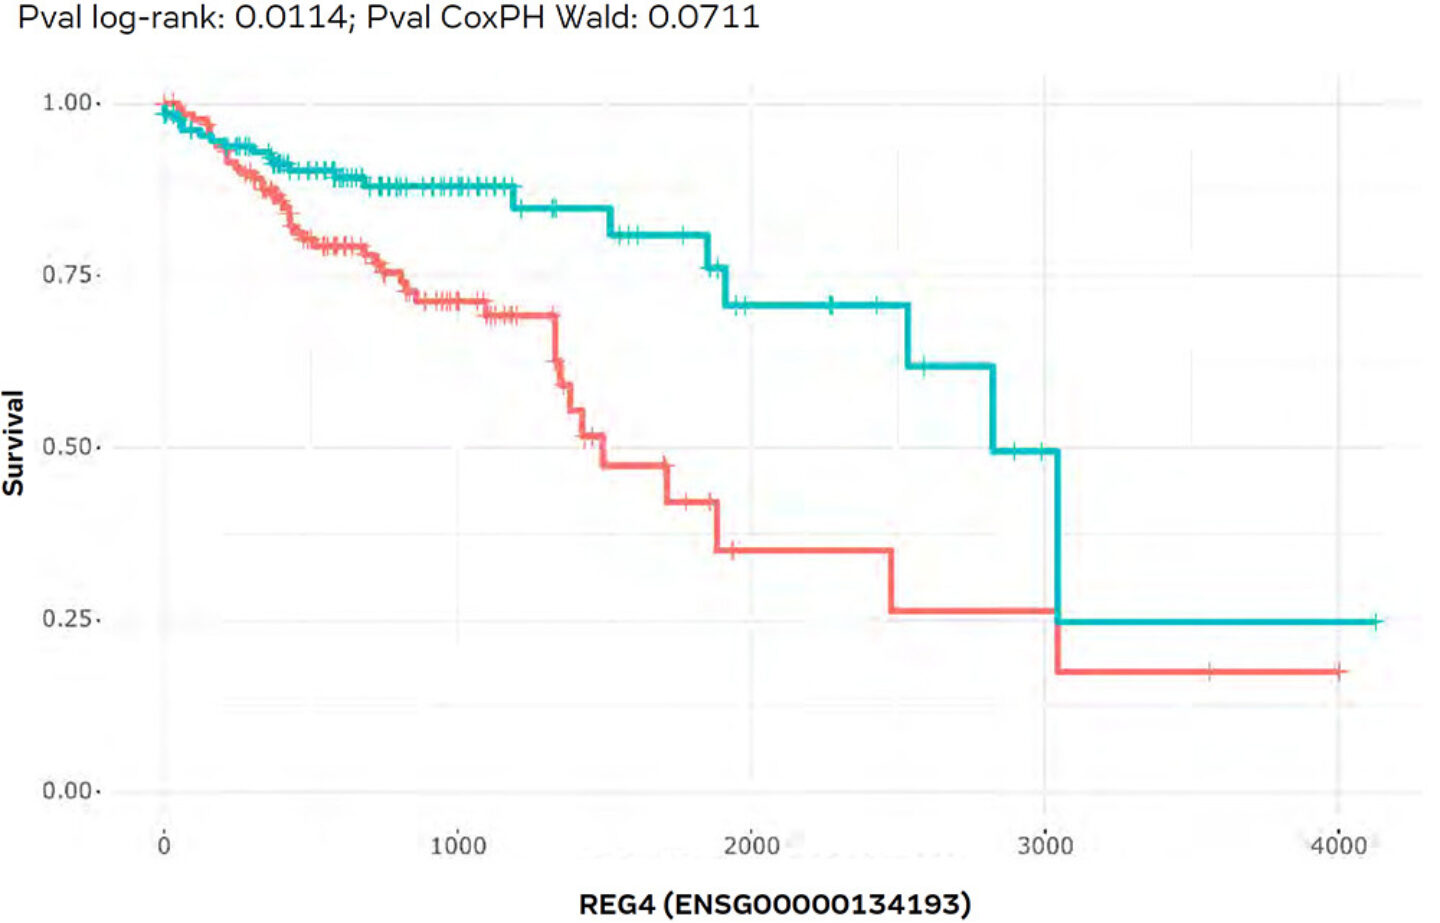
Figure 10: Kaplan-Meier-Plot as Figure X for male patients. Here, we see a significant (p-value = 0.00143) correlation between low REG4 transcription (red curve) and poor survival.