PanHunter: An Interactive Multi-omics Analysis Platform
Your Enterprise Solution to Find the Detail That Matters
The true value of omics data revealed by the premium data analysis platform, Evotec’s PanHunterTM.
The study of health and disease by means of multi-omics research produces huge amounts of interlinked data sets that, in order to reveal their secrets, require analysis by complex bioinformatic platforms. Drug discovery, in particular, is one area of research that is being driven more and more by the analysis of patient data linked to genomic, transcriptomic, proteomic and metabolomic studies. This type of analysis requires a dedicated and flexible software application that should not only be reliable and give reproducible results, but also be able to facilitate collaboration between project investigators and their teams. For this purpose, Evotec has developed a web-based platform – PanHunter – that combines peer-reviewed statistical analysis algorithms with the potential for machine learning and artificial intelligence capabilities. By working with a user-friendly graphical interface, it enables in-depth analysis across multi-omics data sets with a flexibility that can address just a few entries or correlate millions of data points with ease.
PanHunter is web-based, a so-called Software-as-a-Service (SaaS) platform. This means that the software doesn’t have to be physically installed on the user’s computer. SaaS provides the complete PanHunter application to the user and has functionalities that address every aspect of data handling; all the user has to do is to open the graphical user interface on a web browser, log in and start analysing their data. PanHunter has many advantages, to name a few: the web-based system facilitates collaboration; it can be updated with ease to ensure all collaborators are on the same page; and there is no waiting for a data analysis bottleneck to be cleared from the bioinformatics core facility.
Ideally the principal investigator and the study-design team should have a hands-on role because those individuals know what specific questions should be asked of a data set. The bio- informatician in the core facility, when receiving the raw data and the request to analyse it, will probably apply standardised dissection processes and produce a report that at best will be less than ideal; it will not necessarily reflect the experimental hypotheses behind the data and so potentially miss correlations that the data are concealing. With PanHunter, at the investigator’s fingertips, the data can be addressed with the experimental design and methodology in the foreground and then interpreted according to the hypotheses that were used to generate the data in the first place. The level of collaboration afforded by the web-based platform enables the PanHunter user to share data and results at an unprecedented level and with unparalleled ease.
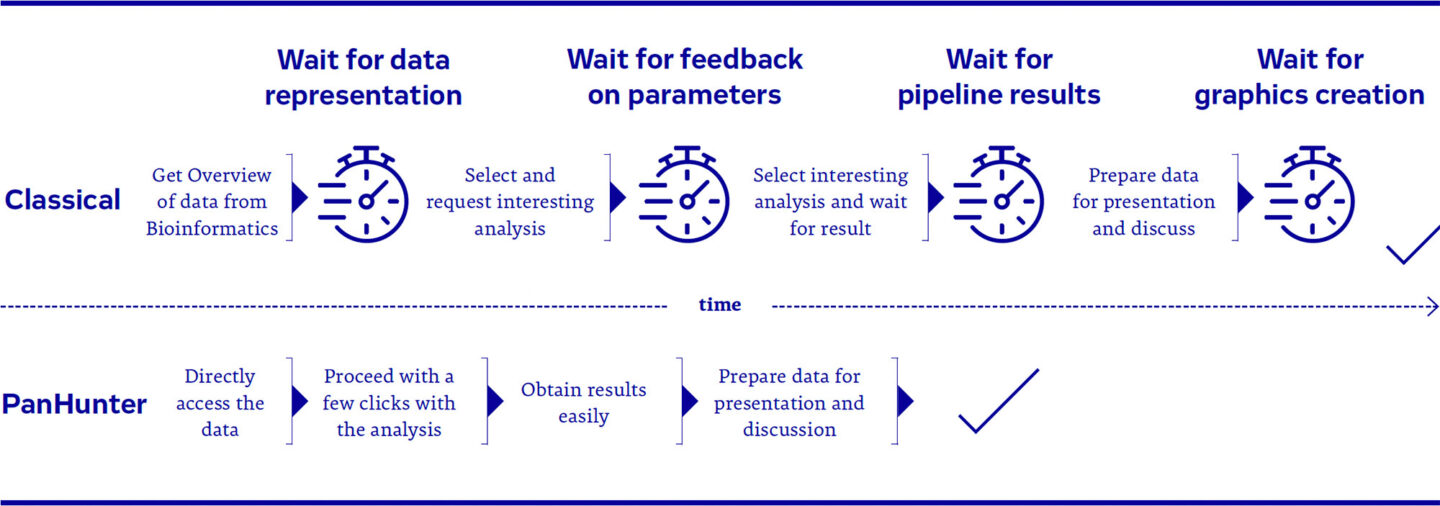
Figure 1: Comparison of a biologist’s data analysis journey between the classical approach and using PanHunter, from data access towards result generation
Unique Features of PanHunter:
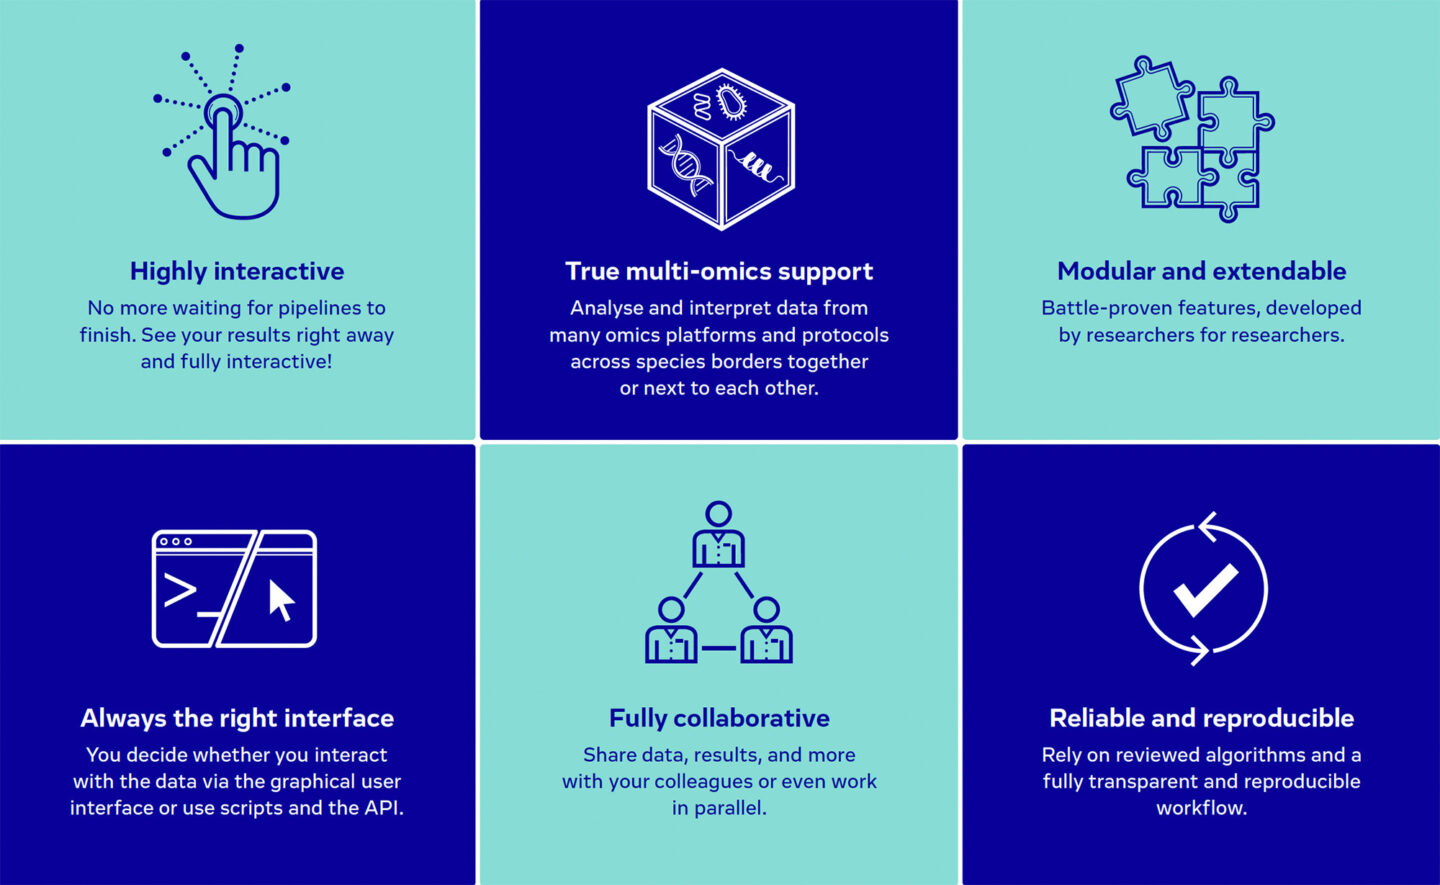
- Highly interactive: The PanHunter user no longer waits for bottlenecks to be cleared. The results appear right away and can be customized for presentations and discussions. Other apps within PanHunter’s library are within the user’s grasp to investigate the data from multiple angles.
- True multi-omics support: PanHunter supports data analysis and interpretation from many omics platforms and protocols across species. The user can interconnect the data sets of different layers to reveal a whole spectrum of insights into disease developments and their treatments.
- Modular and extendable: Opening the PanHunter start-page reveals the range of apps that aid the user during the in-depth analysis of multi-omics data. The ability to combine self-generated data with knowledge in the public domain increases the validity of the analysis and its results.
- Always the right interface: The user can decide whether to interact with their data via the graphical interface and the various apps or to write their own scripts (coming soon). Whatever form of interaction is chosen, the user can always perform data analysis at all depths along the value chain of drug discovery.
- Fully collaborative: The design of PanHunter supports collaboration across teams so that data can be shared, results compared, and reports discussed. Users involved in the same project can access and analyze their data at any time and from anywhere, even simultaneously without overwriting each other’s results.
- Reliable and reproducible: The PanHunter user can rely on the peer-reviewed algorithms that, with the potential to be combined with machine learning and artificial intelligence, lead to fully transparent and reproducible workflows.
The following case study demonstrates the power of PanHunter in fast and easy processing of in vitro toxicity data:
Preclinical toxicity studies are critical in the path of drug discovery as they help to assess the safety of a drug candidate before it is applied in clinical trials. PanHunter offers many dedicated tools for this workflow – for example, a user can identify significant regulation or deregulation of genes, proteins, or metabolites; perform trend analysis to monitor the effects of a series of compound concentrations; and further determine parameters for toxicity studies, such as the ‘point of departure’.
Figure 3: Login page of the PanHunter graphical user interface
This case study sourced its transcriptomic data from an internal toxicity investigation, designed to test the effect of several compounds on a hepatocyte-like cell line in vitro. Each test compound was added to duplicate test plates in eight different concentrations and transcript data gathered after a standardised incubation period. In the first phase of the analysis, PanHunter checked the duplicate plates for data consistency. This phase was followed by an exploration of the data with reference to the different compounds and treatment concentrations. Finally, the data were analysed for the response of the treated cells to the different concentrations of each compound.
In this example, the data set was analysed for consistency using the Sample QC app in PanHunter. This application checks the distribution of transcriptomic data across the whole 384-well plate, comparing both columns and rows in one single data sweep. Graphical representations enable the user to make their own estimation of the data consistency. Here, the data were found to be highly consistent across all samples.
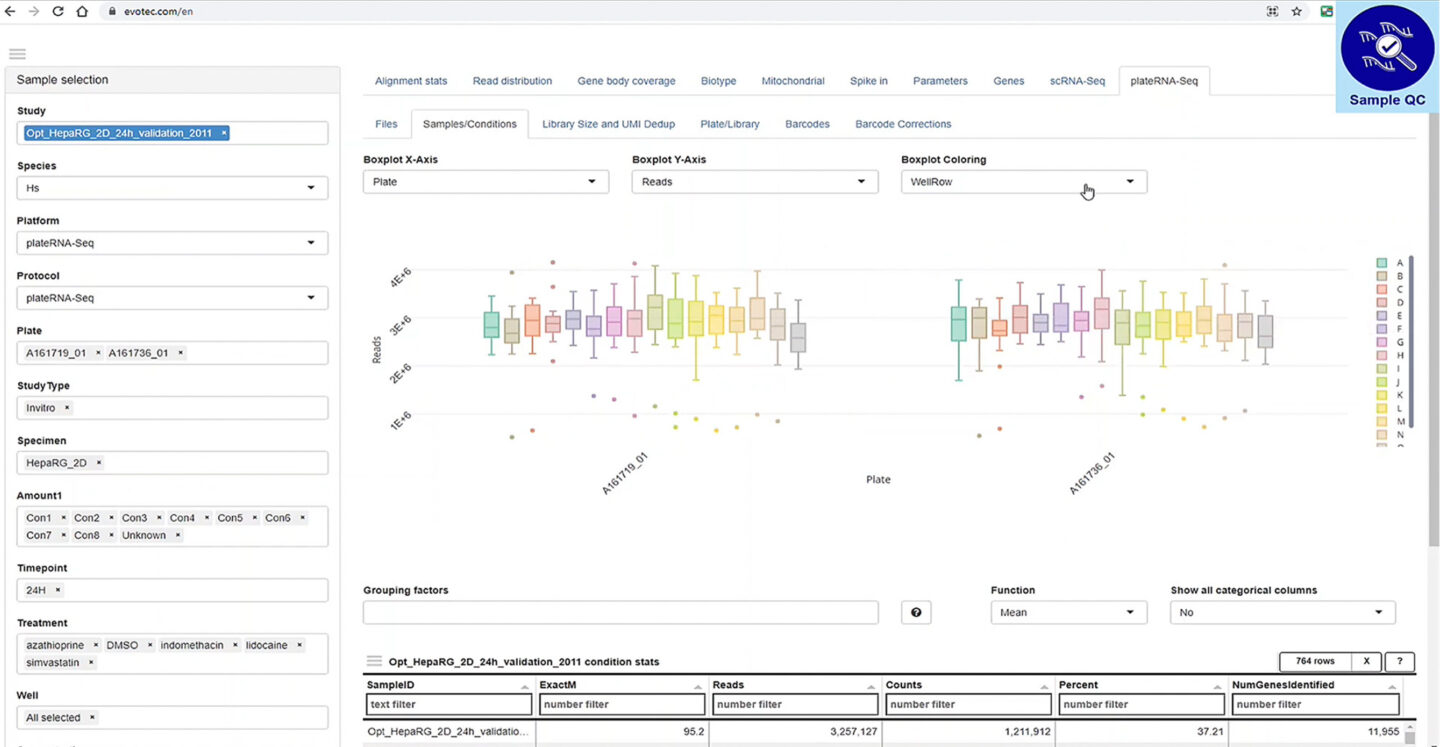
Figure 4: Investigation of sample consistency at the level of sequencing reads using the Sample QC app in PanHunter
Moving on to the exploration phase, the New Comparison app starts by carrying out a principal component analysis on all samples. This procedure reduces the dimensionality of the transcriptomic data and generates a two-dimensional dot plot. The dots represent the whole transcriptome of individual samples and are clustered on the plot based on their transcriptomic similarity. The sample dots from both test plates on the plot are overlapped well, suggesting a consistency in the spectrum of gene expression between the replicates.
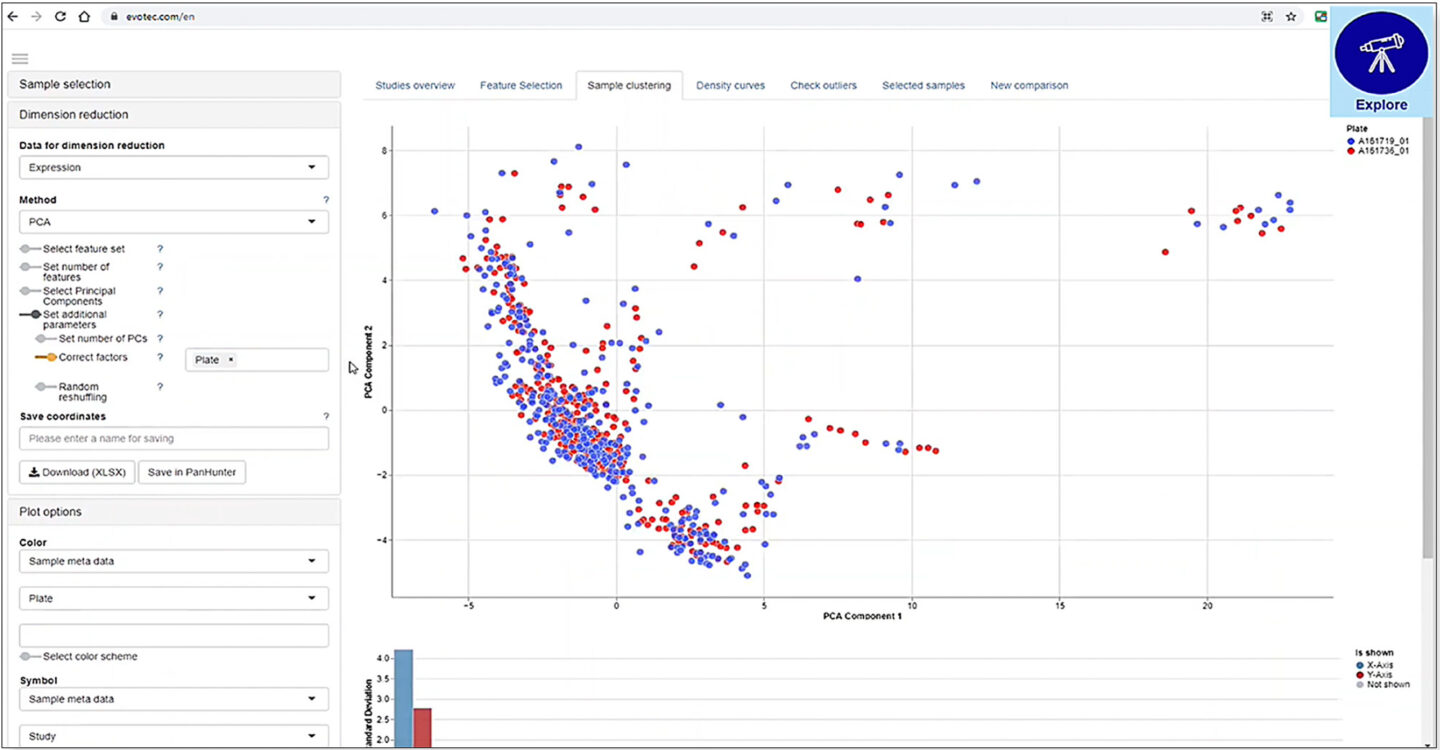
Figure 5: Investigation of sample consistency at the level of transcriptomic similarity via dimension reduction methods using the New Comparison app in PanHunter
By examining the available metadata and transcriptomic data, PanHunter can identify and provide lists of categorical variables, numerical variables and genes that are driving the clusters on the plot. Users can interactively customise the plot according to the parameters of interest. In this case, the plot is coloured by treatment and concentration, which are the main cluster-driving categorical variables suggested by PanHunter.
As might be expected, at high concentrations of test compound, the position of the corresponding sample dots moves away from the ones treated with low concentrations, meaning that the overall gene expression differs dramatically between the conditions. This effect is consistent across all test compounds and is more prominent at higher concentrations.
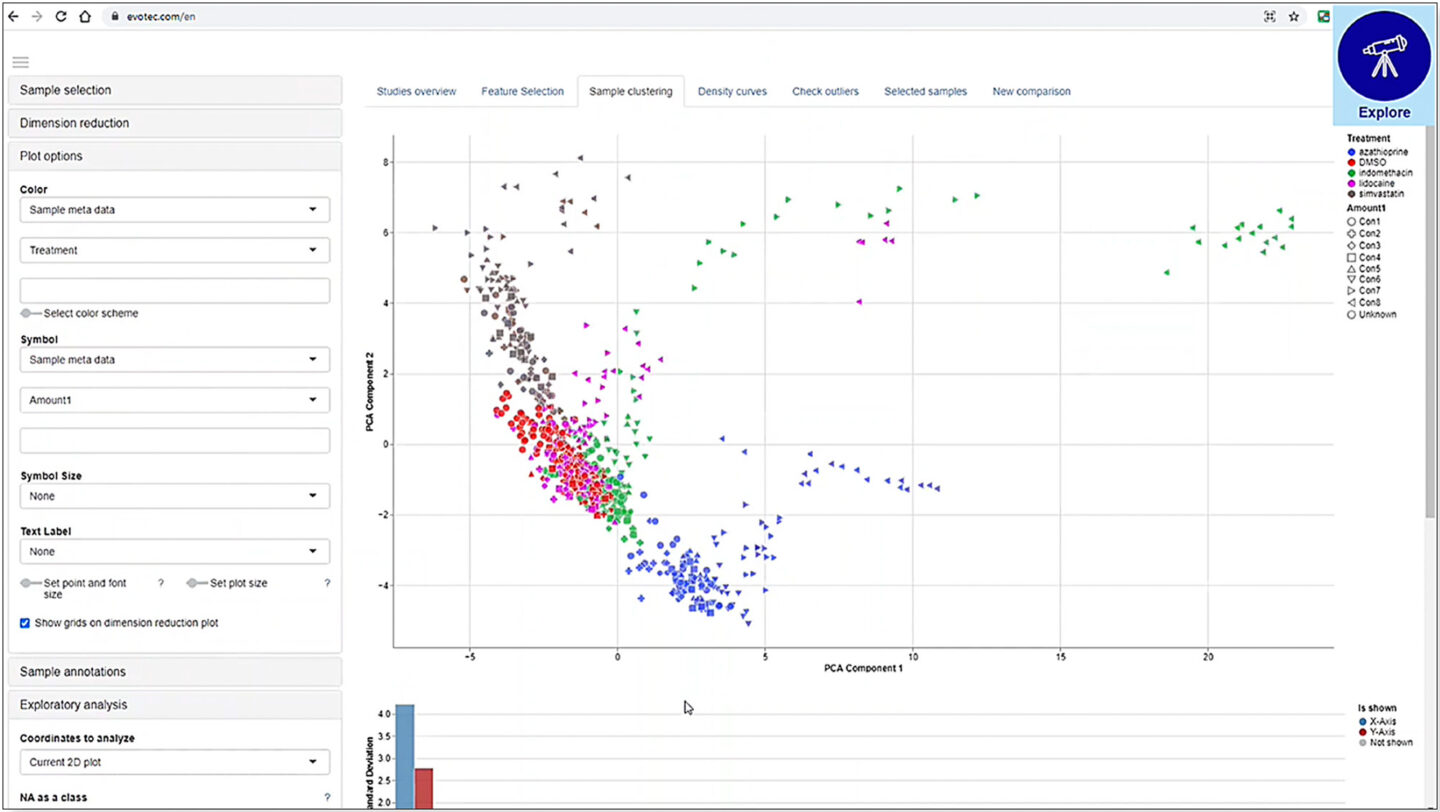
Figure 6: Overview of transcriptomic similarity between samples by colouring the dimension reduction plot with variables of interest
Differential analysis can be performed to identify genes that display significantly different expression levels at different conditions. For this study, a differential analysis using samples treated with high and low concentrations of azathioprine was conducted and saved in PanHunter. The results can then be retrieved from the Top Tables app and are accessible for every user who is involved in the project.
Using the list of differentially expressed genes, PanHunter can perform multiple downstream analyses such as pathway enrichment, signature analysis and so on. The user can interactively visualise and further explore these results using additional apps in PanHunter. In this example, the pathway associated with oxidative stress includes a significantly large number of the differentially expressed genes. PanHunter can generate a graphical overview of this pathway and show which of its constituent genes are up- or downregulated. Moreover, results of two differential analyses can be visually displayed side-by-side on the same pathway diagram, allowing easy comparison and further investigation.
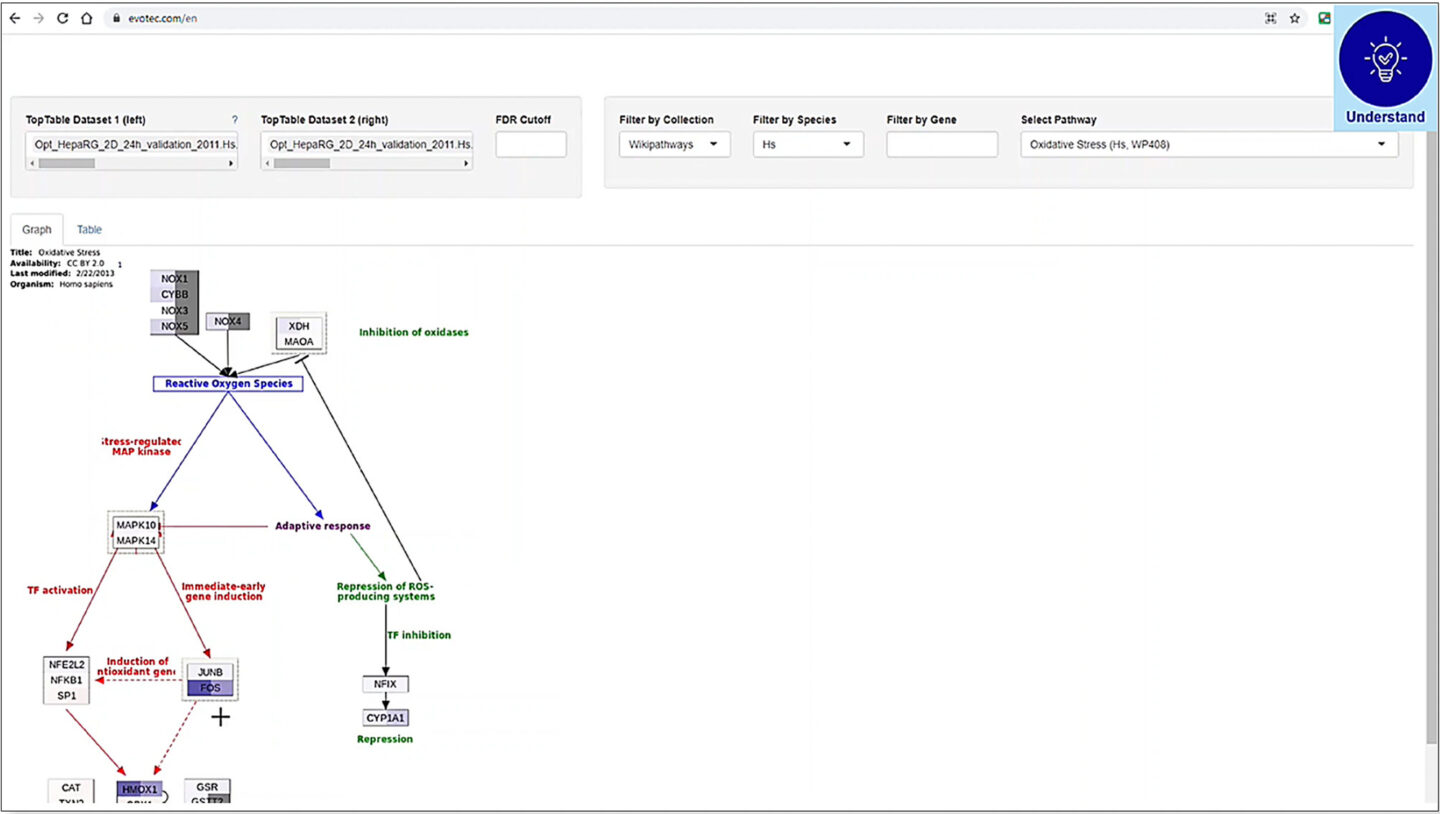
Figure 7: Side-by-side comparison of two differential analysis results on pathway diagram using the Pathway Mapping app in PanHunter
Conclusion
A deeper understanding of a disease at the molecular level is destined to accelerate the drug discovery process and improve the probability of success in both the preclinical and clinical phases. Evotec’s web-based platform, PanHunter, is invaluable at all levels of drug discovery and allows every scientist to analyze their omics data in a sophisticated, efficient, and reproducible manner. Analysis of different omics levels results in a holistic view of health and opens the way to truly understand diseases at the molecular level. By mastering the complexity of data processing with PanHunter, every user and their teams can tap into the wealth of knowledge contained in their omics studies with ease.


